There’s an ongoing debate — is a continuously variable transmission the right ‘box for heavy-lugging draft work? To throw some cats among the argumentative pigeons, we’ve compared the drawbar power measurements of 15 tractors, each fitted with a CVT.
KEEPING IT BRIEF
- The number on the bonnet badge doesn’t matter; what actual power arrives at the wheels does.
- Specific fuel consumption is the best indicator of overall efficiency.
- In some instances, there was a difference in excess of 10% between 6 and 15km/hr.
When it comes to pulling a heavy load, it’s important to know how much of the crankshaft power will actually arrive at the wheels. After all, it is this power that makes a difference when it comes to ploughing or cultivating.
At the same time, the tested specific diesel consumption in grams per kilowatt hour of drawbar power (g/kWh) is a decent and reliable indicator of the efficiency of the overall system, consisting of the engine, transmission, axles, etc. This specifies how many litres (or grammes) of diesel have to be burned to achieve a certain amount of (draft) work.
Measurements in the profi test
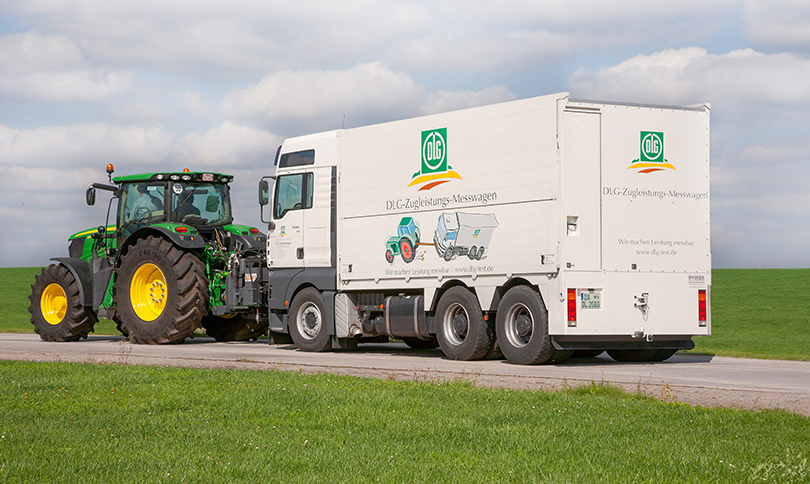
The first thing the DLG test centre does for us in every profi tractor test is measure the tractor’s performance on the pto test stand. When measuring these output curves at full load, the torque is measured in 100 engine rpm increments and computed together with the respective pto outputs. This test procedure reveals the engine speed at which the engine develops its maximum output.
When the tractor then goes in front of the brake truck to measure the drawbar power, the test team uses the engine speed that was previously found to be the ‘maximum output speed’. Then using the continuously variable transmission, the speed at which the drawbar power is highest is searched for step-by-step in a speed band covering around 5.0 to 15km/hr. This value is given in every profi tractor test.
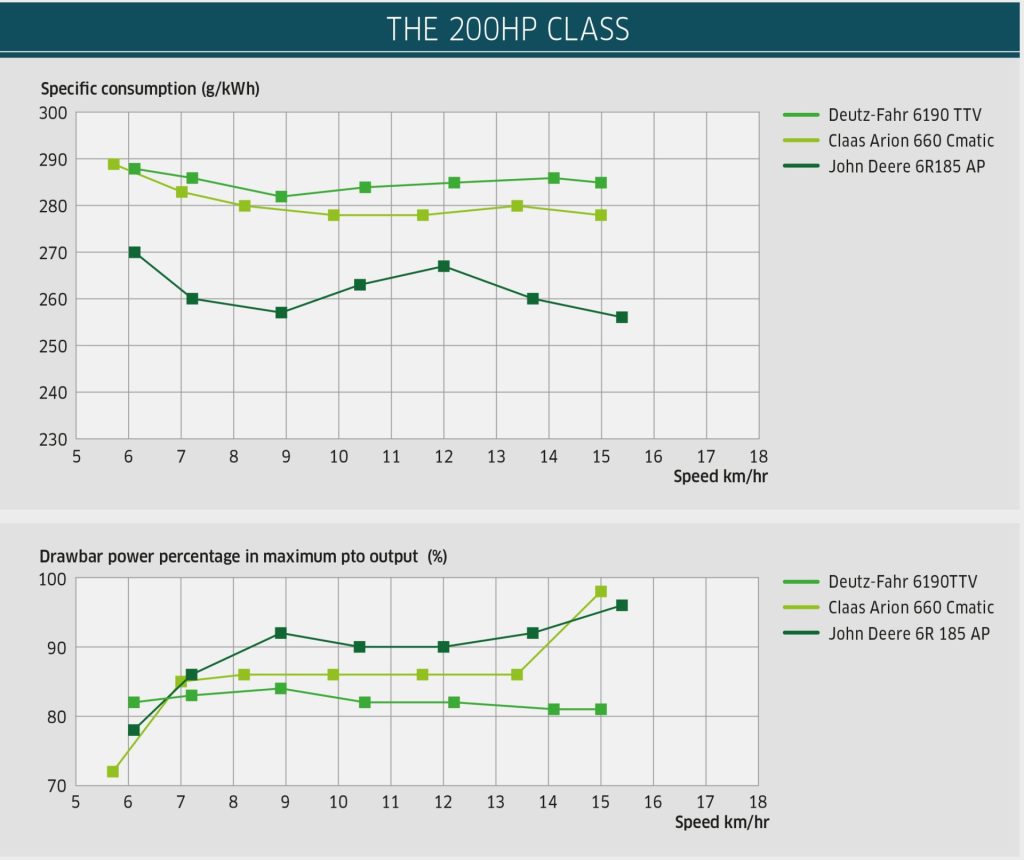
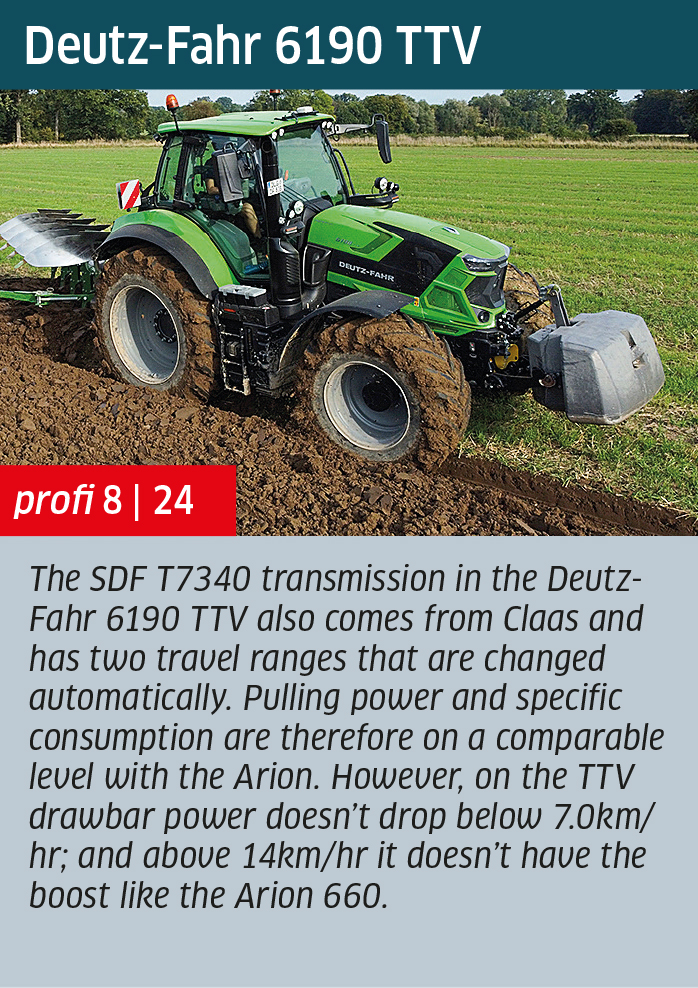
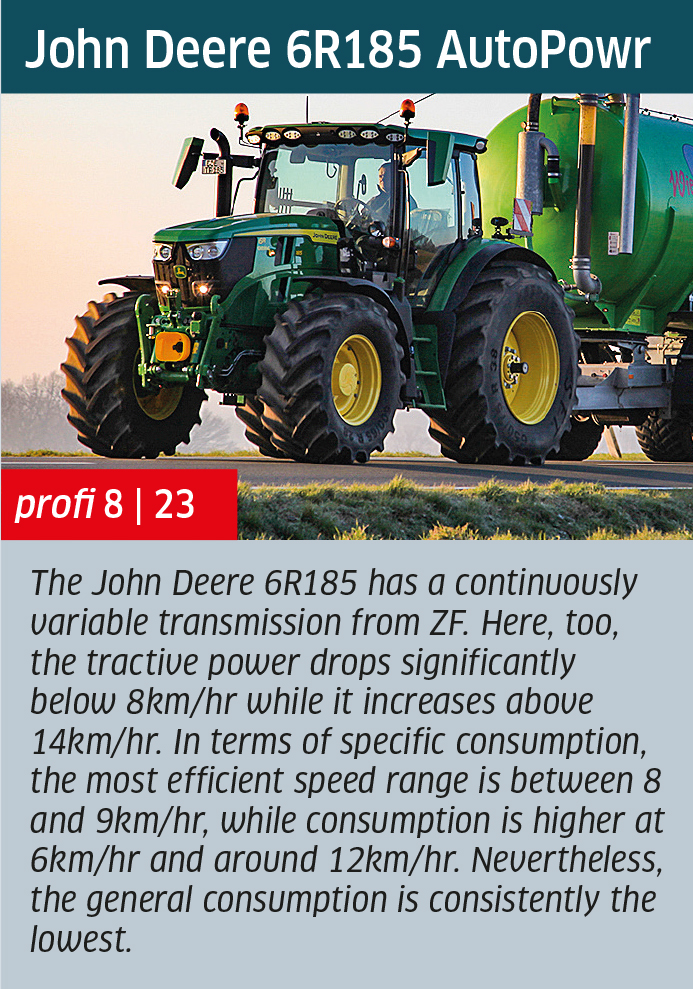
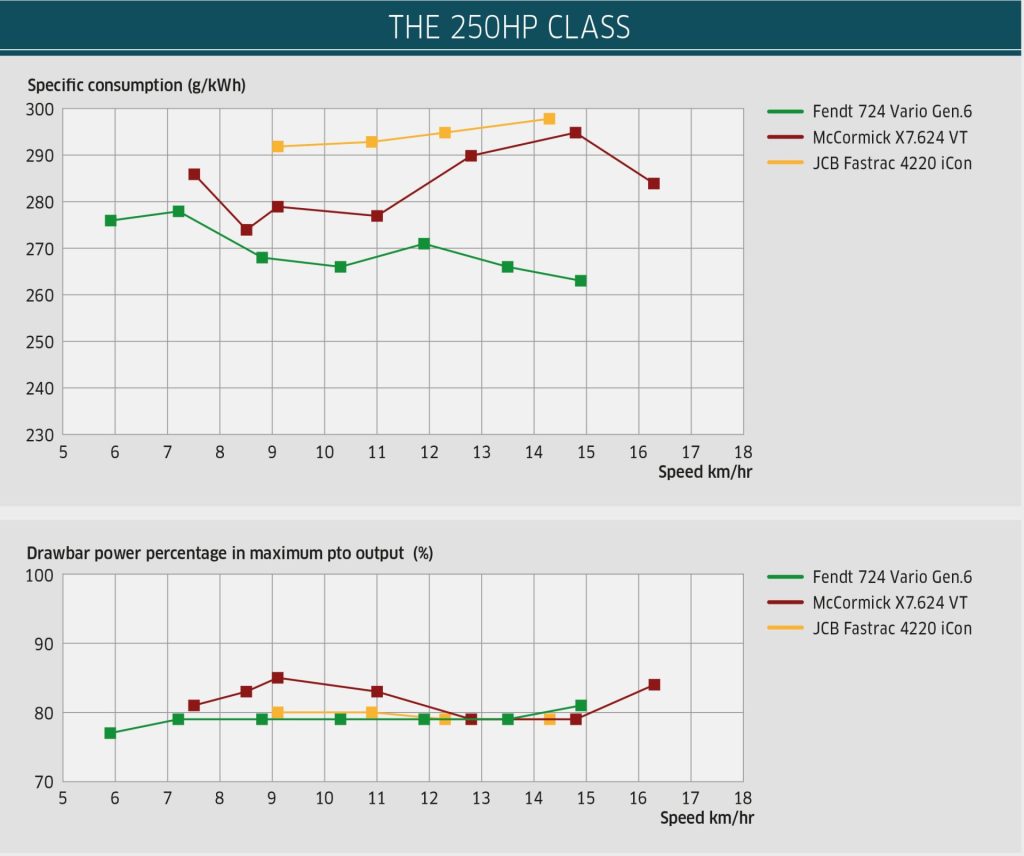
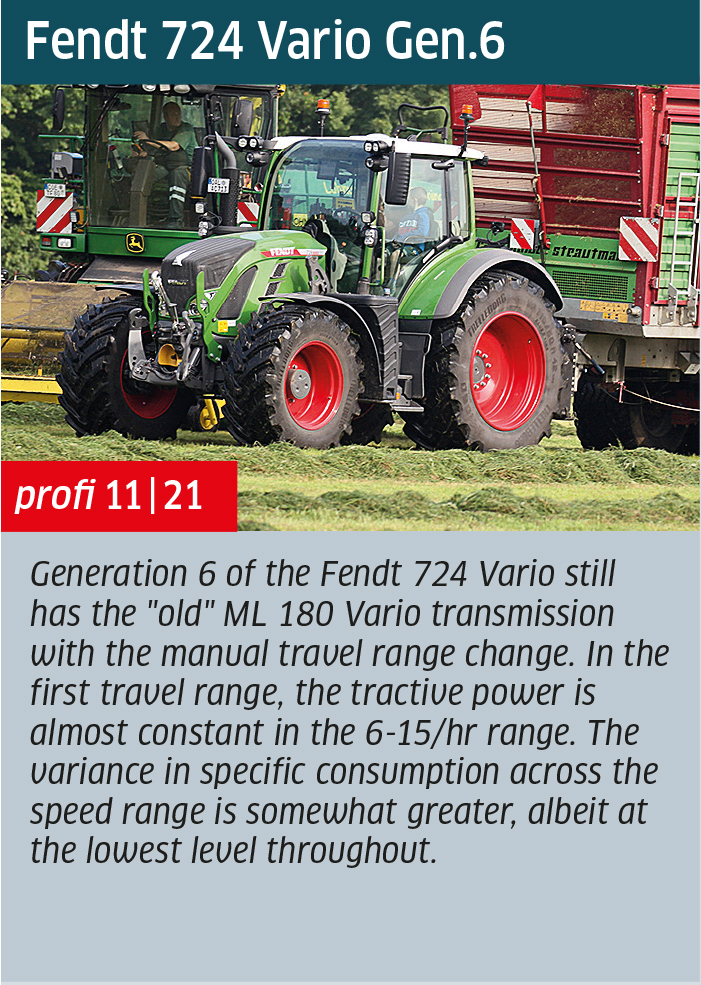
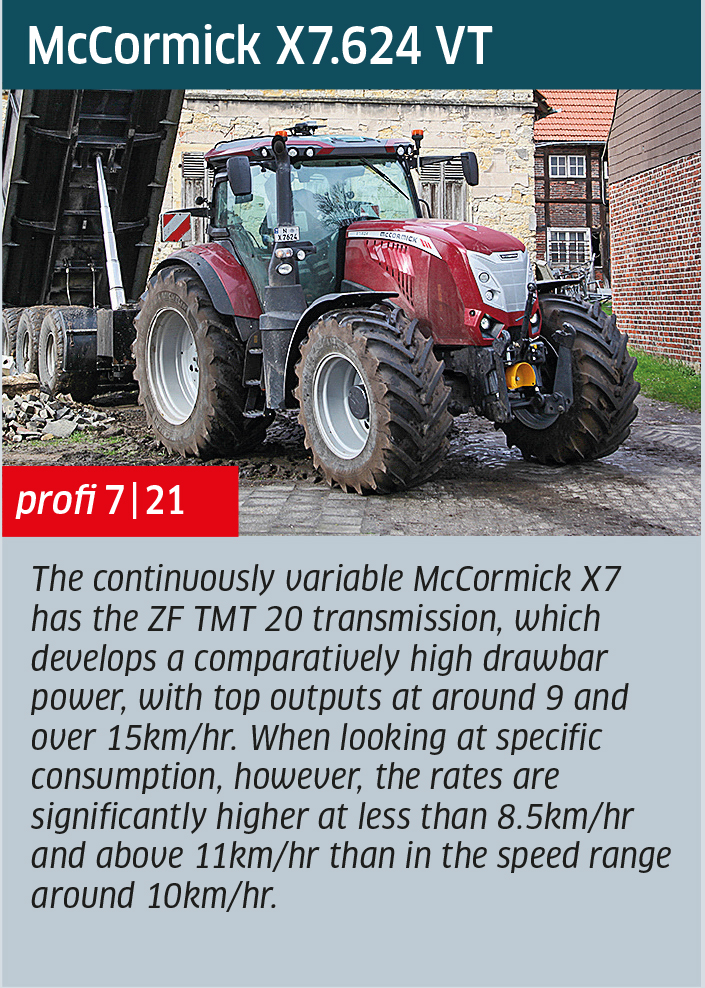
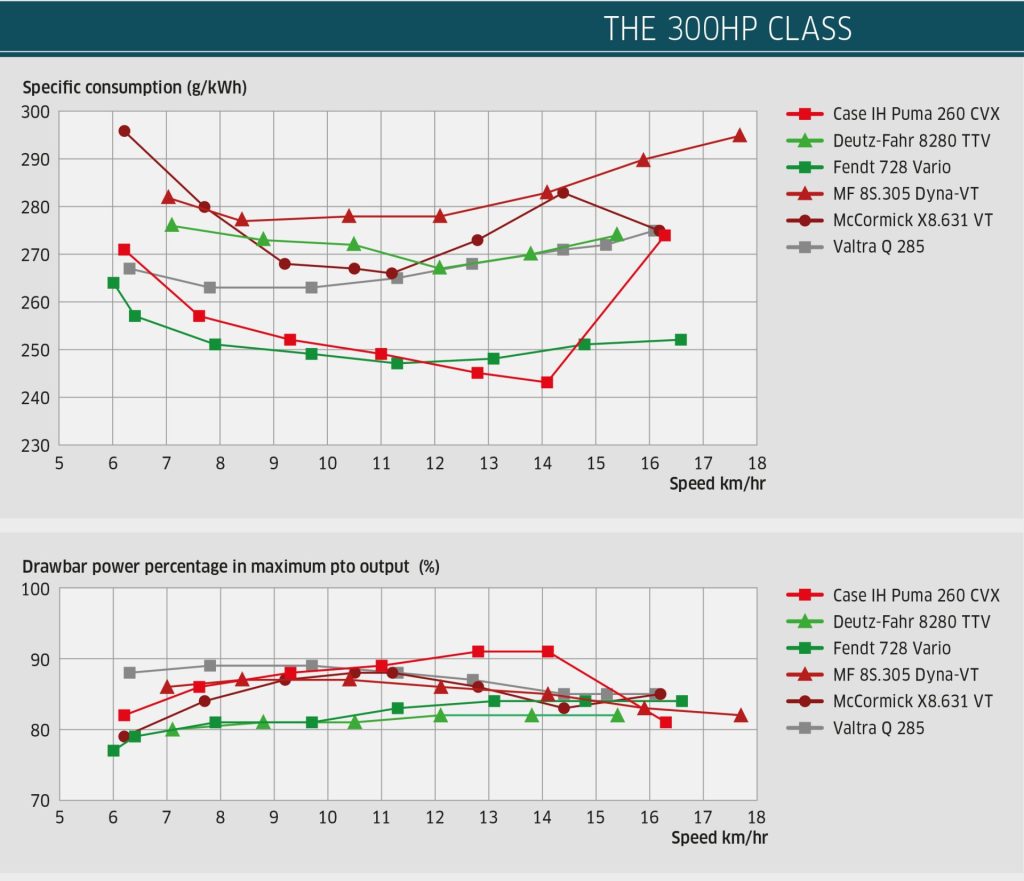
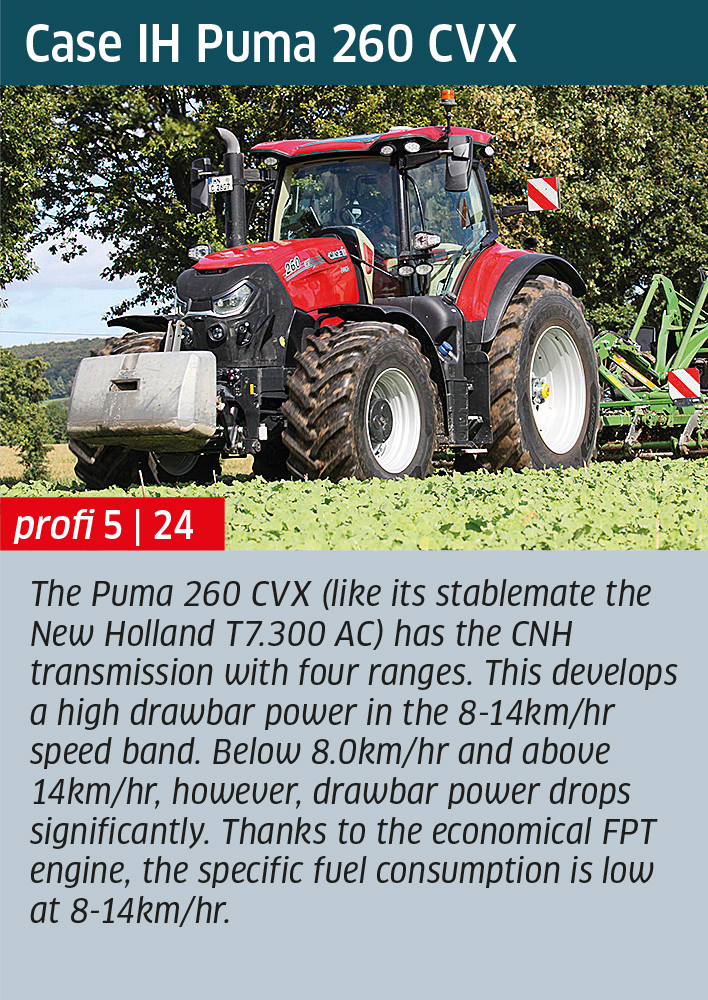
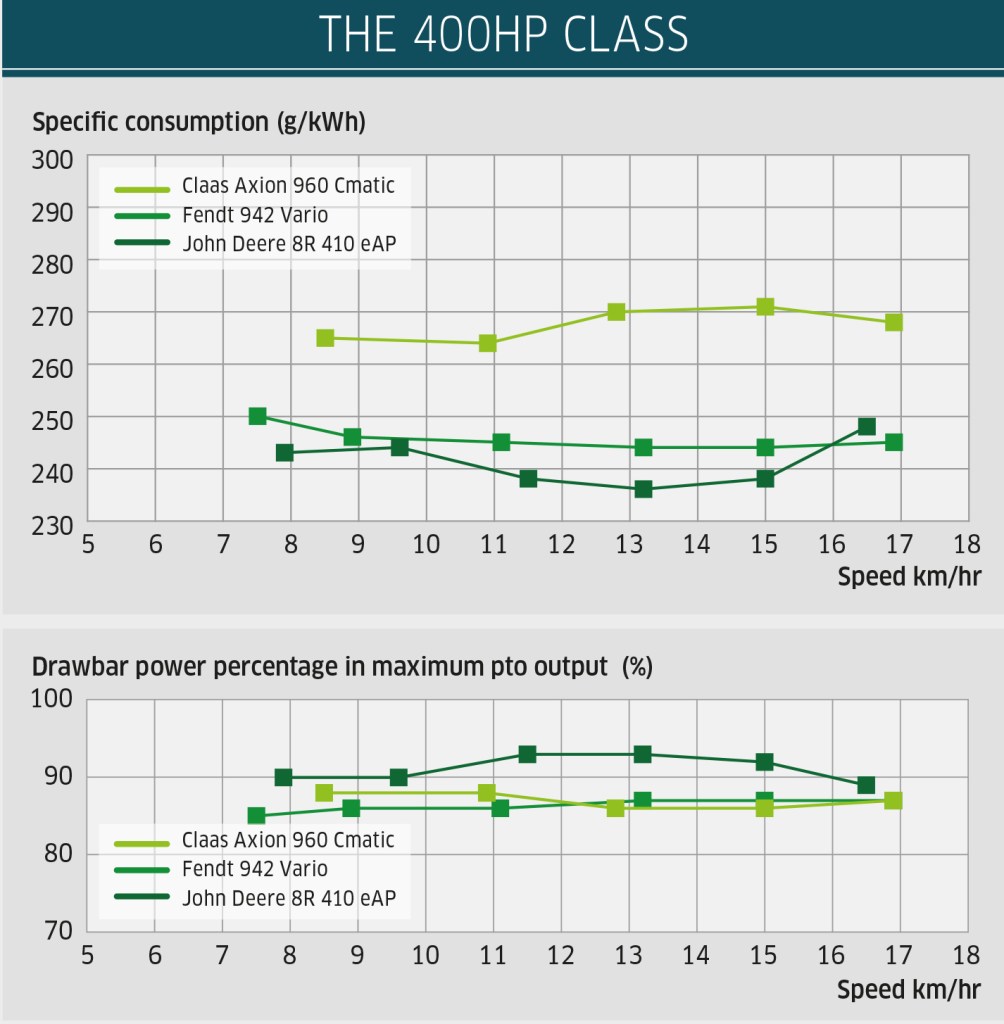
However, since in everyday practice you’ll be subsoiling or deep cultivating at 7.0km/hr and discing at 14km/hr, it is important to look at how the drawbar power curve develops within this speed range. This is why we have compiled these curves for you for the featured 15 CVT tractors in four power brackets (200hp, 250hp, 300hp and 400hp).
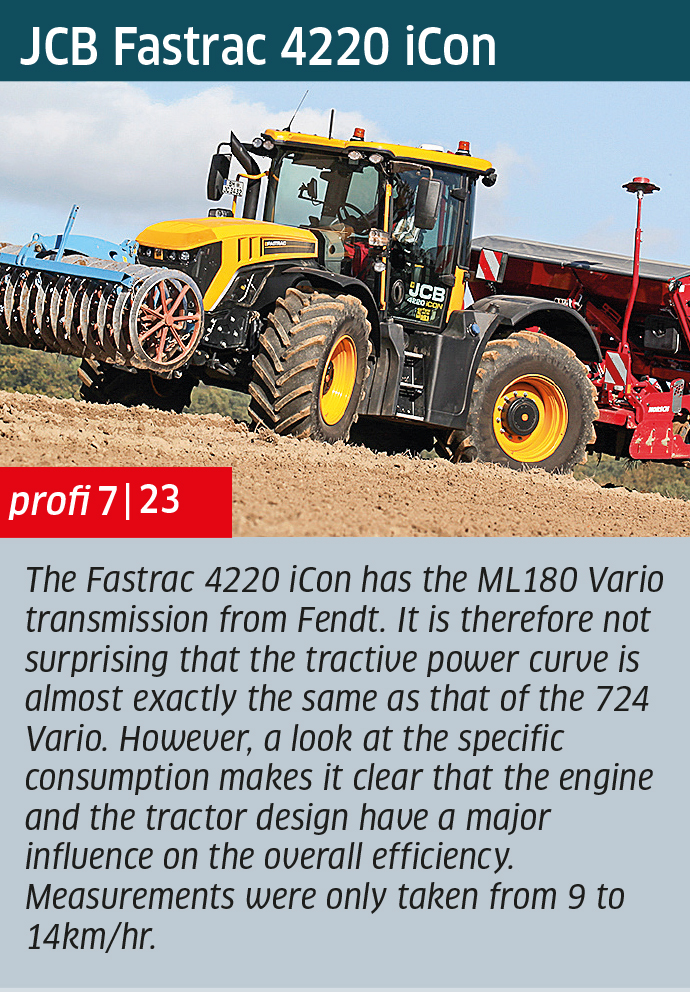
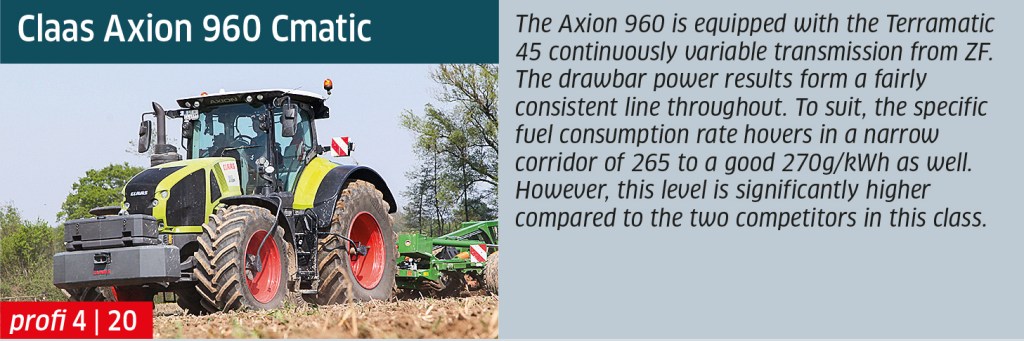
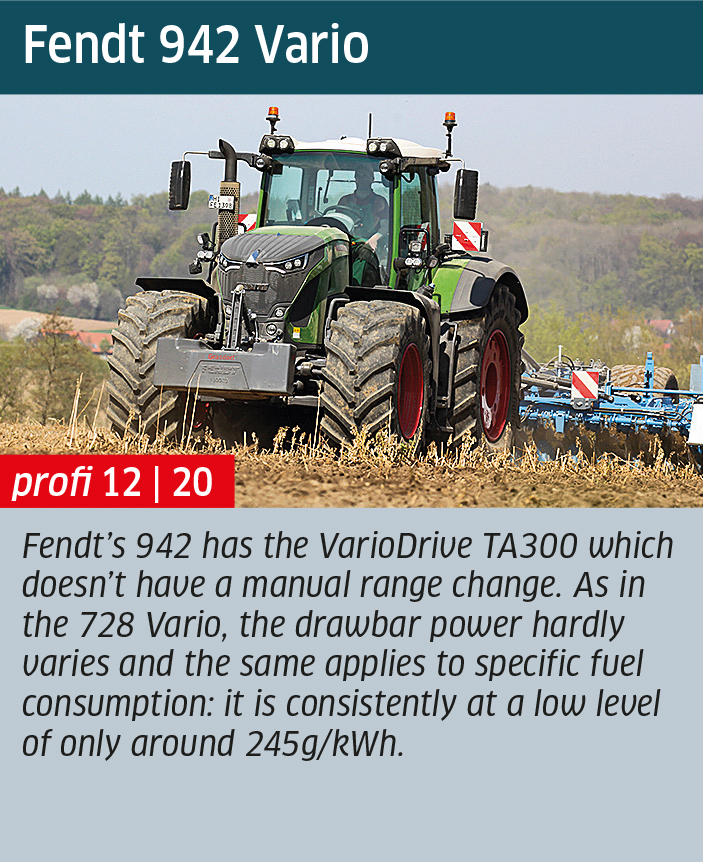
To make it easier to compare the drawbar power curves, we haven’t shown the exact power figures but instead the percentage of drawbar power in relation to measured maximum pto output. However, the highest possible value alone is not decisive, as tractors with a highly efficient pto driveline will perform worse here. What’s more important is the consistent progression of pulling power over the specified speed range, so that you can plough properly at both 7.0km/hr and 14km/hr, for example.
Indicator for efficiency
The correct indicator of efficiency is the graph showing specific fuel consumption per kilowatt hour of drawbar power (g/kWh). If efficiency (and therefore drawbar power) drops while the engine continues guzzling the same amount of fuel at the point of maximum output, the specific consumption per kilowatt hour will rise. This means in practice that the same tractor consumes over 10% more fuel for exactly the same type of work when you drive at 16km/hr instead of 14km/hr!
Other gearbox types, in contrast, produce a relatively consistent efficiency over the mentioned speed range, although the entire system of engine, gearbox and axles isn’t as effective. In this case, specific consumption is then consistently higher.
Summary
The results from those 15 tractors in four power bands show that there are sometimes major differences, but often only relatively minor differences in transmission efficiency depending on the forward speed.
In order to work as efficiently as possible with your CVT gearbox tractor, you should keep an eye on the current fuel consumption per hectare as you select the driving speed and engine speed droop. This is the only way of finding the setting that optimises the interaction between the engine and transmission and enables your tractor to work in the most fuel-efficient manner.
Hubert Wilmer
On the following pages, the 15 tractors are split into four power bands. To make it easier to compare the transmissions, we don’t show the actual tractive power but the percentage of tractive power in the max pto output. More detailed measurements on each individual tractor can be found in the various tractor tests in the respective magazine issues.
For more up-to-date farming news click here and subscribe now to profi and save.